在1panel中可以直接安装prometheus的docker服务
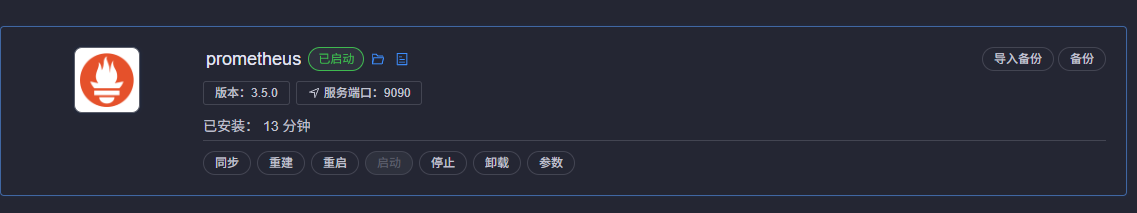
启动之后就可以通过9090访问web页面
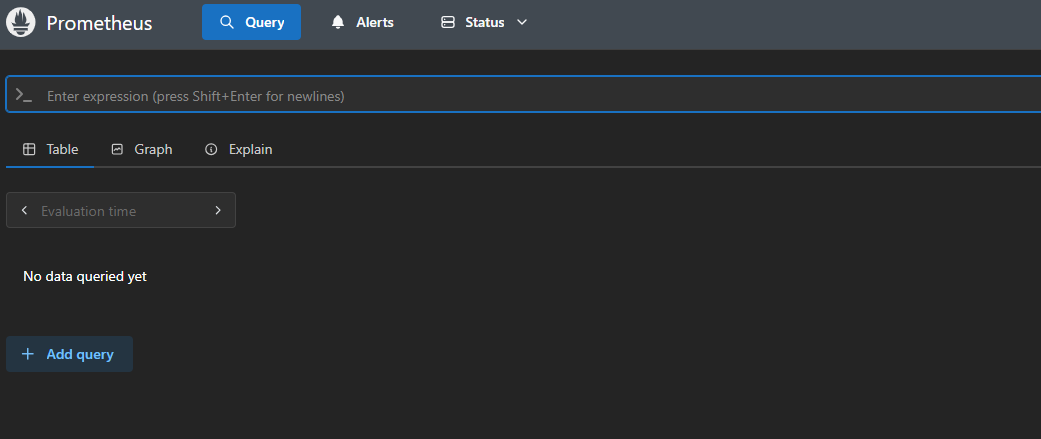
但是这时候没有接入任何数据,只是对本机进行了一个监控。接下来需要接入数据。
Prometheus有两种监控方式,一种是exporter,另外一种就是gateway。通俗地讲就是一个是安装agent,通过与agent通信获取信息,一个是网络探测,通过接口获取信息。
windows下的监控节点安装
部署节点:
部署 Windows Exporter
1. 安装方法
方法一:MSI 安装包(推荐)
# 下载地址:https://github.com/prometheus-community/windows_exporter/releases
msiexec /i windows_exporter-0.25.1-amd64.msi ENABLED_COLLECTORS="cpu,memory,net,logical_disk,os"
参数说明:ENABLED_COLLECTORS可指定启用的采集器(默认包含 cpu/memory/net/logical_disk/os)
方法二:命令行安装
# 下载二进制包
Invoke-WebRequest -Uri "https://github.com/prometheus-community/windows_exporter/releases/download/v0.25.1/windows_exporter-0.25.1-amd64.zip" -OutFile "windows_exporter.zip"
Expand-Archive -Path "windows_exporter.zip" -DestinationPath "C:\exporters"
# 注册服务
sc.exe create windows_exporter binPath= "C:\exporters\windows_exporter.exe --collectors.enabled cpu,memory,net,logical_disk,os" start=auto
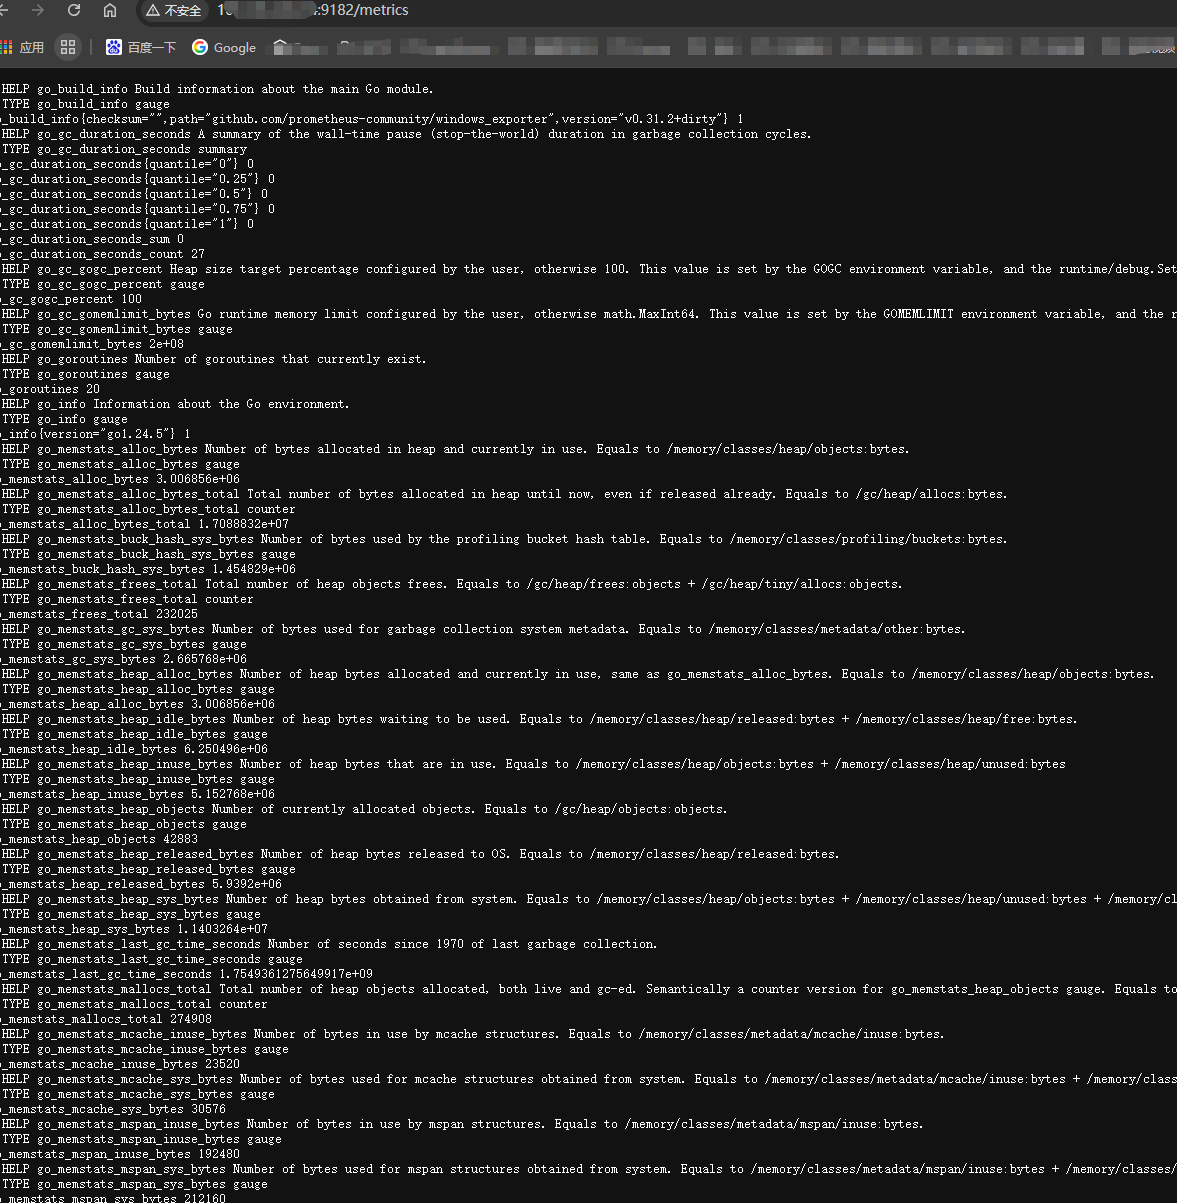
2. 验证数据采集
# 访问本地指标接口
Invoke-WebRequest -Uri "http://localhost:9182/metrics" | Select-Object Content
应返回包含 CPU、内存等指标的文本内容。
3. 防火墙配置
New-NetFirewallRule -DisplayName "Prometheus Windows Exporter" -Direction Inbound -Action Allow -Protocol TCP -LocalPort 9182
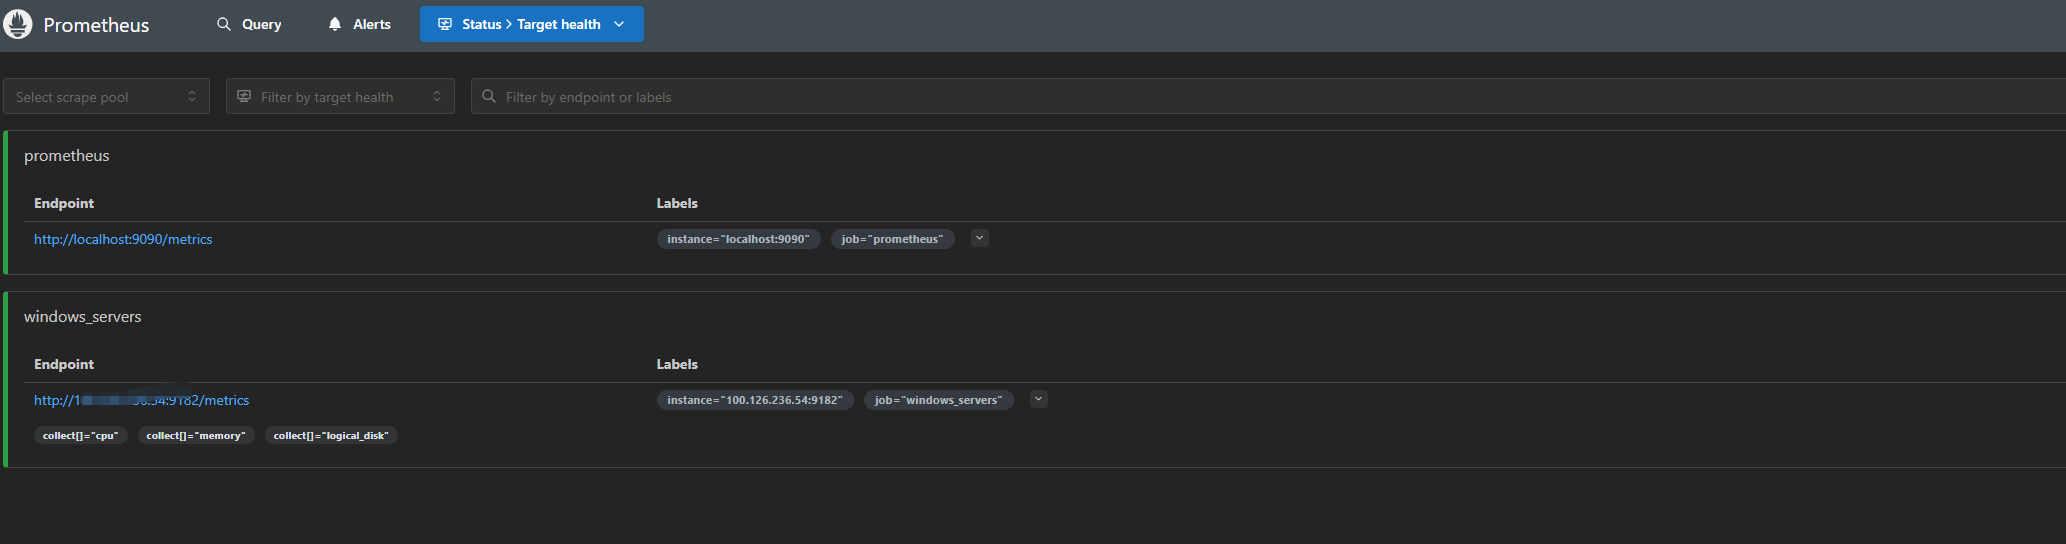
安装好后,就可以通过接口看到相关的信息了
Prometheus server端配置
在/Prometheus.yml文件中田间目标的信息
- job_name: 'windows_servers'
    static_configs:
      - targets: ['192.168.1.100:9182']  # 被监控Windows服务器IP
    metrics_path: /metrics
    params:
      collect[]:
        - cpu
        - memory
        - logical_disk
注意docker中需要进入docker内配置
需要root权限,以及sh命令,可以使用这个命令:
docker exec -it -u root /bin/sh
然后等待数据回传即可,如果嫌慢可以重启容器,或者进一步配置,设置Prometheus获取监控的时间间隔。